Orthopedic decision-making depends on accurate representation of anatomy—particularly when joint alignment and bone relationships change…

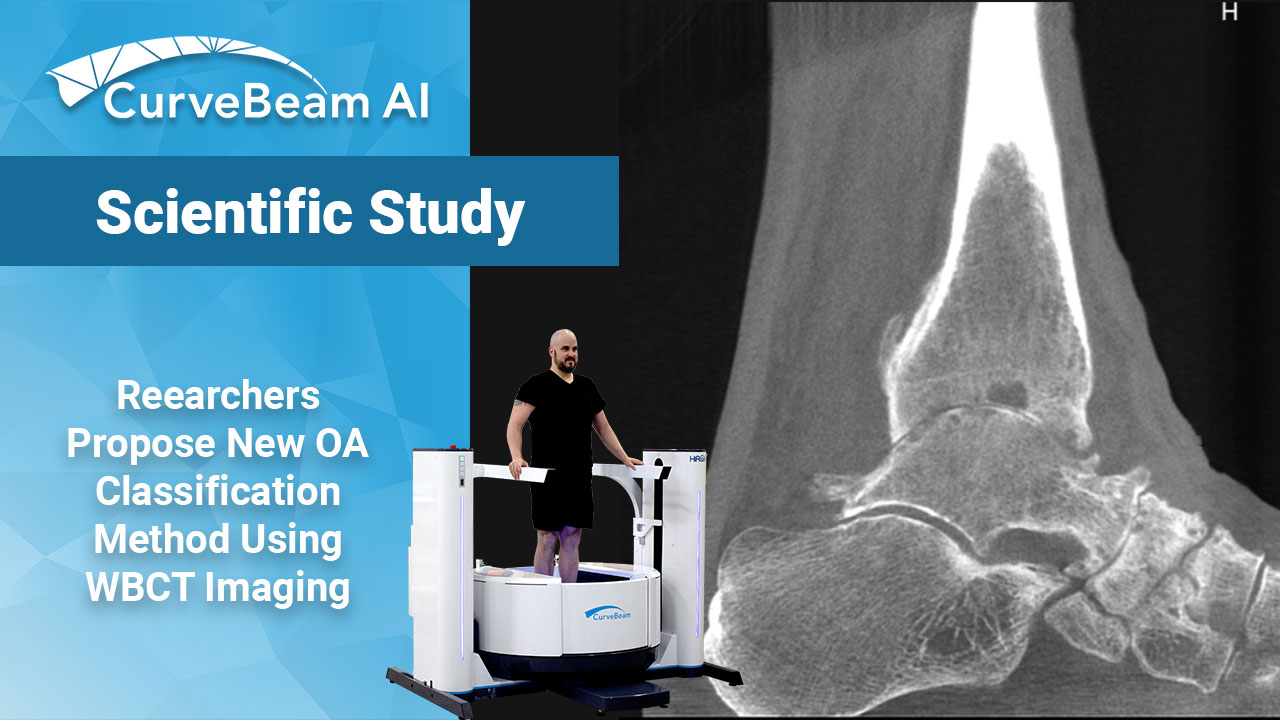
Researchers Propose New OA Classification Method Using WBCT Imaging
Key Points:
- The Kellgren Lawrence (KL) grade is the most common system used to classify osteoarthritis (OA) severity, but it is a subjective evaluation with fair or poor reliability.
- Researchers described a new method of quantifying ankle osteoarthritis (OA) by measuring subtle changes in joint space width (JSW) on weight bearing CT (WBCT) scans to detect subtle changes in the subchondral bone or joint cartilage.
- This software-based method may offer a starting point to develop a new OA classification system and a deeper understanding of the disease.
Ankle osteoarthritis (OA) treatment varies depending on the severity and distribution of the associated joint degeneration. Treatment for OA ranges from anti-inflammatory medications to worst case scenario, ankle replacement. Because of this wide range of treatment options, there is a need for reliable and reproducible methods to measure and classify the severity of OA.
The most common method of OA classification is based on 2D radiographs and has not been updated since its introduction in 1957 by Kellgren and Lawrence (KL). KL grading subjectively evaluates the presence and significance of osteophytes, bony sclerosis, joint space narrowing, and deformity of the bone ends. Unfortunately, the reliability, inter- and intra-observer agreement are at best fair or poor due to their subjective nature.
Weight Bearing CT (WBCT) allows for low dose 3D radiographic imaging while a patient is in a natural standing position. WBCT offers significant clinical advantages when compared to X-Ray, especially crucial when it comes to OA where thinning of the ankle cartilage, softening of the cartilage, and other deformities become more apparent under load. WBCT also provides a better geometric representation of the ankle and allows for more accurate measurements when compared to X-Ray.
Dr. Tutku E. Tazegul, BBME, Dr. Cesar de Cesar de Netto, MD, PhD et al. out of the Department of Orthopaedics and Rehabilitation, Carver College of Medicine, University of Iowa, Iowa City, IA conducted a study utilizing joint space width (JSW) and Hounsfeld Units (HU) as their primary measurements with a goal of detecting subtle changes in the subchondral bone or joint cartilage. They found that the ability to have quantitative measurements and objective point selections within each joint would in theory improve the reliability and reproducibility of OA grading when compared to subjective classification systems which are currently used.
Material and Methods
The study compared two patients with clinical and radiographic diagnosis of ankle OA and one healthy control that underwent WBCT of the foot and ankle for assessment of a forefoot pathology. Severity of KL was evaluated using the KL grading system. Patients whose ankles had substantially different KL grades were selected for this study to provide an initial demonstration of the computational analysis capabilities across a range of OA severity.
Images were acquired from a CurveBeam WBCT scanner and were analyzed CubeVue, CurveBeam’s visualization software, which gave 3D data sets in sagittal, coronal, and axial multiplanar reconstruction (MPR) views.
Researchers used CubeVue’s distance measurement tools to identify the center of the tibiotalar joint space. For any ankles with complete joint space narrowing, the axial plane was adjusted to approximately the point of contact between the distal tibia and the talar dome.
Once identified, a volume of interest (VOI) tool was used to place a predefined 20x20x20mm cube at the center of the tibiotalar joint space. The distribution of voxel intensities were measured within the entire selected volume. The points and projections served as representations of the HU distribution was measured along linear projections in the anteromedial, anterolateral, posteromedial, and posterolateral aspects of the ankle joint. Each line collected image intensity data across the transition of distal tibial cancellous and subchondral bone, the joint space, and talar subchondral and cancellous bone, in that order. The intensity profiles were recorded, and graphical plots of the HU distributions were generated for each line, which were used to calculate the JSW and HU contrast.
Results
The research showed that the average JSW was 3.89 mm for the healthy control ankle, 2.69 mm for the mildly arthritic ankle, and 1.57 mm for the severely arthritic ankle. The average HU contrast was 72.31 for the healthy control ankle, 62.69 for the mildly arthritic ankle, and 33.98 for the severely arthritic ankle.
Researchers noted that one projection in the severely arthritic ankle had JSW and contrast values of 0 because of complete joint space loss along projection 4, which corresponds in this case to the posterolateral part of the joint.
Conclusion
Researchers concluded that using WBCT to quantify OA was simple and could easily be incorporated into the workflow for OA staging if the appropriate tools (i.e., WBCT and analysis software) were available. The ability to have quantitative measurements and objective point selections within each joint would in theory improve the reliability and reproducibility of OA grading when compared to subjective classification systems which are currently used.
It was noted that while this study was limited by its small sample of patients and OA severities, assessment could be more challenging when radiologic findings such as osteophytes, cysts, and severe subchondral sclerosis are present inside the selected HU dispersion. Researchers said that 3D mesh algorithms would need to be implemented to evaluate the shortest bone distances more precisely between the sub-chondral bones of 2 opposing articular surfaces.
To read the full study please click here.


