When CT Is Not Enough In a recent discussion on the clinical value of weight…
Researchers Find Two WBCT Measurements that Diagnose PCFD Almost Perfectly
Key Points
- A study from Clinique de I’Union found that a combination of 2D and 3D measurements used on WBCT images resulted in 100% sensitivity and specificity when it came to accurate measurements for PCFD.
- MF% demonstrated slightly better specificity while FAO better sensitivity.
- Researchers also concluded that in the future, highly accurate 3D WBCT and measurements from this study could be used beyond diagnosis to assess the results of corrective realignment surgery in PCFD as well as help better understand the relationship between hindfoot and lower limb alignment.
Adult Acquired Flatfoot Deformity (AAFD), a common orthopaedic condition, often results in Progressive Collapsing Foot Deformity (PCFD) due to the displacement of complex three-dimensional (3D) hindfoot and midfoot bones.
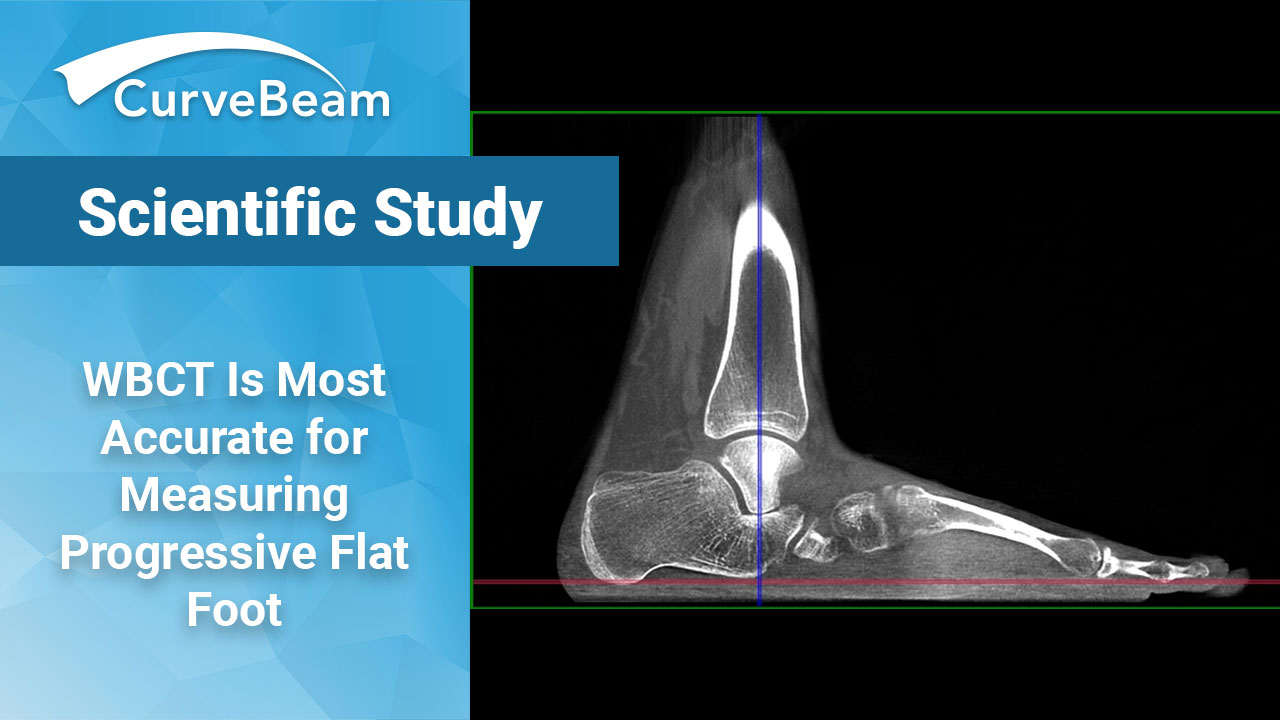
A recent study from Clinique de I’Union in Saint Jean, France, found that utilizing a combination of 2D and 3D measurements on Weight Bearing CT (WBCT) images demonstrated that threshold values of 28.7% for uncoverage (MF%) and 4.6% for Foot Ankle Offset (FAO) resulted in 100% sensitivity and specificity, respectively, when it came to accurate measurements for PCFD.
“The most significant finding in this study was that the combination of a 2D and a 3D measurement performed on WBCT images, namely the middle subtalar facet uncoverage and the foot and ankle offset, leads to the highest diagnostic accuracy in PCFD,” the study found.
The study, by Dr. Francois Lintz et al, was published in the January 2022 issue of Foot and Ankle Surgery.
Materials and Methods
The study compared 23 patients with symptomatic PCFD feet as well as 28 controls who all received WBCT investigation as part of standard follow up.
The following 2D measurements were recorded: axial and sagittal talus-first metatarsal angles (TM1A and TM1S), talonavicular coverage angle (TNCA), forefoot arch angle (FFAA), angle of incongruence (MF°) and MF% of the middle facet of the subtalar joint. FAO was obtained using the dedicated semi-automatic software TALAS by CurveBeam. (As TALAS is a 3D measurement, it was obtained only from the 3D coronal, sagittal and axial views, not from the radiographic 2D views.) Receiver Operating Characteristic (ROC) curves and their respective values for area under the curve (AUC) were used to determine thresholds for each variable with the best combination of specificity and sensitivity as a diagnostic test for PCFD. The measurements were performed twice in an independent, blinded, and random fashion by a PhD-trained orthopaedic foot and ankle clinical research assistant and repeated by a fellowship trained, board certified senior foot and ankle surgeon on both groups. Measurements were performed after completion of a mentored 3 cases training protocol in order to ensure repeatability of the measurements and secure adequate software usage. For assessment of reliability, the second set of measurements was performed 3 weeks after the first one was completed in order to minimize the memory bias.
Results
Substantial to almost perfect intraobserver and interobserver reliabilities for all parameters assessed in the study were found. In PCFD, mean ( ± SD) MF% and MF° were respectively 47.2% ± 15.4 and 13.3° ± 5.3 compared with 13.5% ± 8.7 and 5.6° ± 2.9 in controls (p < 0.001 for both). The FAO was 8.1% ± 3.8 in PCFD and 1.4% ± 1.7 in controls (p < 0.001). Areas under the curve for Receiver Operating Characteristic (ROC) curves were 0.99 (95% CI 0.98–1) for MF%, 0.96 (95% CI 0.91–1) for FAO, 0.90 (95% CI 0.81–0.98) for MF°. For MF%, a threshold value equal or greater than 28.7% was found to be diagnostic of PCFD with a sensitivity of 100% and a specificity of 92.8%. Conversely, a threshold value for FAO equal or greater than 4.6% had a specificity of 100% and a sensitivity of 89.2% in identifying PCFD. The FFAA was decreased in PCFD: 5.5° ± 5.8 versus 14.8° ± 4.3 in controls (p < 0.001). Axial and sagittal TM1 angles were 16.2° ± 8.8 and 22.8° ± 9.6, respectively in PCFD, while in controls: 7.2° ± 5.6 (p < 0.001) and 8.2° ± 6.3 (p < 0.001). The TNCA was increased in PCFD: 27.8° ± 11.9 versus 14.2° ± 6.7 (p < 0.001) in controls.
Conclusion
The study concluded that WBCT images demonstrated high diagnostic accuracy of the percentage of uncoverage of the middle facet and the FAO in detecting PCFD. Due to the 100% sensitivity of the first and 100% specificity of the second, researchers recommend using both in order to achieve the best accuracy in the diagnosis of PCFD. 3D measurements were 100% specific (no false positives but 10.8% false negatives, while conversely the 2D measurements were 100% sensitive (no false negatives but 7.2% false positives. MF% and FAO used singularly classified correctly 99% and 96% of subjects, respectively, whereas all other measurements classified 90% or less of subjects correctly.
Researchers also stated that in the future, highly accurate 3D WBCT and measurements used in this study could be used beyond diagnosis to assess the results of corrective realignment surgery in PCFD as well as help better understand the relationship between hindfoot and lower limb alignment.
To read the full study click here.
Related Posts